
SAP SAC Key Features

Easy Data Analysis and Visualization
SAP Analytics Cloud has intuitive tools that allow users to explore their data, create interactive dashboards, and generate meaningful reports. These visual representations make it easier to analyze and understand complex data patterns.

Planning and Forecasting
With powerful planning and predictive analytics tools, SAP Analytics Cloud enables companies to create well-founded future forecasts based on their data. Users can also model scenarios and create and adapt financial plans directly within the platform.

Integration and Connectivity
SAP Analytics Cloud integrates seamlessly with existing SAP and non-SAP systems, enabling access to real-time data and providing a unified view of all company data. It can handle both on-premise and cloud data sets, ensuring flexible data management.
Data Analytics and Visualization in SAP SAC for Your Teaching
SAP UCC Magdeburg provides access to the SAP Analytics Cloud environment for data modeling and visualization. A total of up to 100 students can access the learning environment simultaneously. The sales data of the fictitious model company Global Bike enables a vivid demonstration and testing of relevant processes and procedures.
Lecturers have access to teaching materials, such as ready-to-use presentations, exercises, and case studies that can be used both in teaching and in research projects.
The entire curriculum is available in both in German and English.
… gives an insight into the basic concepts of data analysis and visualization.
- What is a cloud?
- important terms
- functionality of SAP Analytics Cloud
… explains how to navigate in SAP Analytics Cloud. Afterward, users will be able to navigate in SAP Analytics Cloud in order to work on processes and exercises independently.
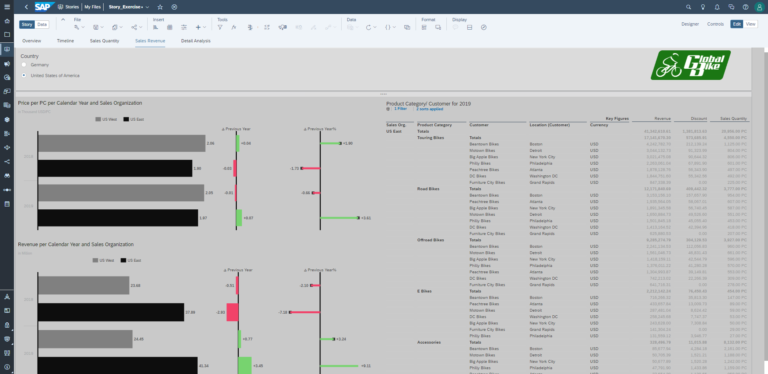
With this case study, students learn the basics of data analysis and visualization and apply their new skills in SAP Analytics Cloud hands-on by implementing a simple sales dashboard for Global Bike’s middle management.
- get to know SAP Analytics model types
- create a story
- visualize data using the Story Builder
In this case study, students create an analytical model that is loaded with their data and analyze it. They understand the dimensions and metrics of an analytic model and assess the model’s performance. With this knowledge, the students can create and evaluate their own story.
- understanding the dimensions and metrics of an analytic model
- creating and evaluating a story
Basic concepts of business planning with SAC are explained.In a supplementary case study, different options for defining calculations in the planning model are highlighted.
- Creating a planning model
- Creation of manual planning options
- Automatic copying and editing of data
- Definition of calculations using the example of sales prices
… is becoming increasingly important, and this case study presents Global Bike as a responsible player in the mobility sector that is setting a strong example for climate protection. The case study explains the creation process of two models and a story on the topic of sustainability in SAP Analytics Cloud. We recommend successfully completing the two case studies on the Story Builder and Modeler beforehand in order to be optimally prepared.
- Creation of calculated key figures to determine the CO2 footprint of business trips
- Building, linking and using two models
- Model 1: Participant data including places of origin and means of transportation used
- Model 2: Emissions data of the means of transportation such as car, bus, train, plane,…
- Development of a meaningful story that visualizes and analyzes the travel data and the resulting CO2 footprint
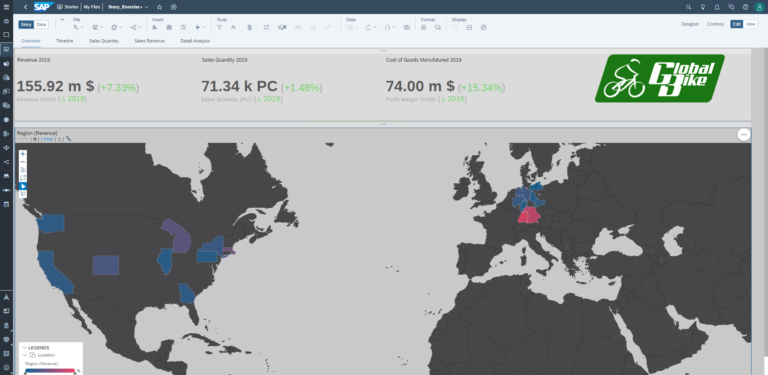
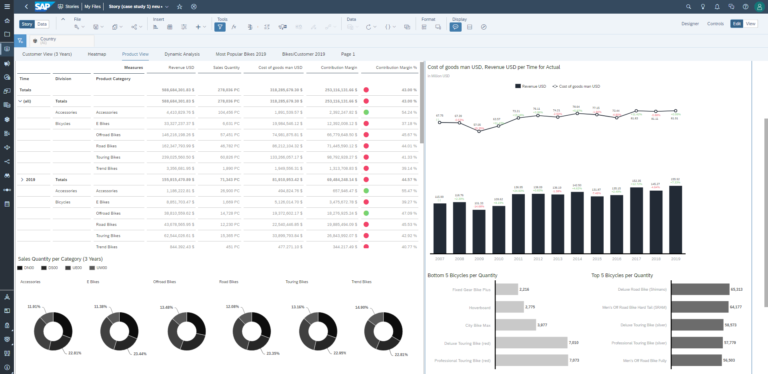
SAP SAC Dashboard Examples
Request a free trial version now!
The SAP UCC offers academic teaching staff free 30-day trial access to Data Analytics and Visualization in SAP SAC, including educational materials. If you are interested and for more information, click the button to contact our customer service.
Please note: This offer is only available to academic teaching staff. Students should contact their teacher.
Das sagen die Dozierenden

How Your Apprenticeship Continues
The SAP UCC Magdeburg offers you further practical curricula on current SAP solutions so that you can realise the full potential of your teaching and your students.